You may be wondering: “What the heck is a Konami Code, and why does it matter for fantasy football?” Back in the mid-80s, Nintendo developers needed a quick way to test the video game “Gradius” without losing progress due to the difficulty of the game. They created a cheat code that would give the player a full set of power-ups that would normally have to be earned throughout the campaign of the game. By entering the code sequence using the controller, the game developer received all available power-ups.
Originally, this code was meant to be removed prior to publishing the game, but this was overlooked and discovered later when the game was being prepared for mass production. The developers decided to leave it there, as removing it could result in new bugs and glitches. Eventually, word got out, and consumers became aware of how to use the Konami Code while playing to easily defeat the game. Simply put, the Konami Code was a cheat code. The Konami Code eventually found itself in other games including “Contra”.
Fast forward to 2013. Fantasy football analyst Rich Hribar publishes an article advocating for mobile/rushing QBs in fantasy football. The argument was simple. Rushing QBs score more fantasy points, and therefore are more valuable in all formats. Using them above other replacement levels QBs provided your fantasy team with such a competitive advantage, it was essentially cheating. Thus, the birth of the Konami Code Quarterback.
(Mr. Konami Code himself – Lamar Jackson, embarrassing Bengal defenders.)
The Konami Way
Hribar lays out the rationale perfectly for why mobile QBs are the way to go in fantasy football. By looking back at this past season, we see why his theory is validated. In 2019, eight of the top ten fantasy finishers at the quarterback position had at least 50 rushing attempts. The only two who didn’t reach that threshold: Aaron Rogers and Patrick Mahomes, who missed three games with a patella injury. Additionally, three of the top four QB finishers had at least 75 rushing attempts (Lamar Jackson, Deshaun Watson and Russell Wilson all are being drafted top 5 at their position in 2020). Looking at the QBs who started at least 10 games in 2019 and finished outside the top 20 on a points per game basis (QB21-QB30), we see that eight of them failed to rush the ball more than 35 times. The take home message here is simple. Generally, Quarterbacks who rush the ball often are more valuable than those who do not.
Finding Mobile Quarterbacks
Where the fantasy football community tends to frown upon the notion of “copy and paste rankings” for the following season, there is evidence that suggests previous rushing totals predict future rushing totals. Looking at Data from 2018 and 2019, there is a strong correlation between carries in year one (n) and carries the following season (n+1).
Want a QB who runs the ball a lot? Just look at last year’s statistics.
So Why Are We Here?
Well, with these Konami Code QBs running around more, there is a debate as to whether or not these players are at greater risk of injury. If we simply look at injury rates for QBs in the pocket vs. rushing outside the pocket, the data is rather underwhelming.
Let's back up. Excluding any runs or scrambles there's an injury once every 341 pass attempts. This makes sense bc a vast majority of times nothing happens to QBs at all. When you break it down by categories this is what you get. pic.twitter.com/3ma0zh9wd3
— Edwin Porras, DPT (@FBInjuryDoc) July 5, 2020
As Edwin Porras, DPT from Fantasy Points explains, there’s little evidence to suggest that these players are more at risk for injury. I would counter that it’s not that clear cut and there is some inherent risk that comes with drafting these QBs. When the quarterback becomes a ball carrier, he’s exposed to a higher rate of hits. In my opinion, increasing the exposure to contact puts the player at a higher risk of injury.
I don’t think it’s far-fetched to argue that more body blows can increase the risk of a player breaking down. Allow me to further play devil’s advocate by laying out the following scenario. If a QB plays ten snaps, the first nine plays he runs the ball and is hit each time. Then on the 10th snap he throws from the pocket and is injured by a hit. How do we know that it was not an accumulation of those previous nine hits instead of just the last blow? Furthermore, what does the accumulation of those hits do to the player’s career?
My Research
The argument I’m making is that QBs contacted/hit at a higher rate are in fact at a higher risk of injury. Even if you disagree with the point, (and it’s okay if you do, because there’s still some holes in the data) the results of this little experiment will at least show which Konami Code QBs are “safer,” i.e. they slide or get out of bounds rather than exposing themselves to hits.
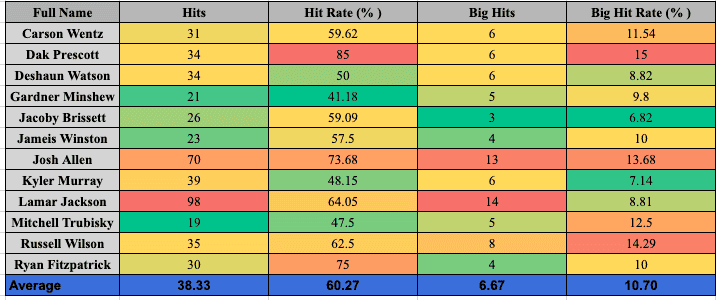
For clarity purposes, I will supply my findings below and define what each term represents:
- Scramble: Broken play where QB went through some sort of read progression prior to deciding to tuck the ball and run.
- Designed Run: Play that involved either a zone read where QB kept the ball or was designed for the QB to be the rusher.
- Hits: Number of times the play end with a defender tackling or pushing the QB to the ground.
- Hit Rate: Percentage of hits per carry
- Big Hits: From studying some film, it was evident that not all tackles were created equal. Therefore I labeled a cluster of these hits as “Big Hits” (I will admit this metric was more subjective). Big Hits involved plays where:1)The QB suffered a jarring blow from defender,
2)The QB was hit in the head/face, or
3) The QB was injured on the play - Big Hit Rate: Percentage of big hits per carry
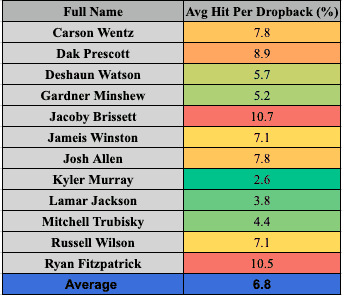
- Hit Rate Per Drop Back: Rate that QBs were hit per drop back while passing the ball.
For my Konami Code QB population I used QBs who rushed the ball at least 40 times over the season, excluding kneel downs. This sample included 12 QBs: Carson Wentz, Dak Prescott, Deshaun Watson, Gardner Minshew, Jacoby Brissett, Jameis Winston, Josh Allen, Kyler Murray, Lamar Jackson, Mitchell Trubisky, Russell Wilson, and Ryan Fitzpatrick. I felt like this group was a good representation of the Konami Code QBs. I looked at every single rushing play for these QBs to determine if they were hit, slid to avoid contact, or got out of bounds. Obviously I would have liked to observe every rushing play for all the QBs in 2019, but for time’s sake and my own sanity, these were the QBs selected. However, if there is one limitation of my research here, it’s that the sample used is not an exhaustive list of the mobile QBs.
Results
When looking at the previous two seasons, QBs were hit on average 6.8% of the time when passing the ball (sample of 125 QBs from 2018-2019). The Konami Code group was contacted nearly 10 times more at 60.3%. My findings also showed that the Big Hit Rate on rushing plays was 10.7%. The table below shows these findings.


I also wanted to compare the rate that Konami Code QBs were hit per drop back to the overall sample. The Results showed that average hit rate per dropback on passing downs was the same as the 125 QB sample from 2018-2019.
When looking at the correlation values from the data I collected, there was a decent relationship between both the number of designed runs and red zone rushing attempts with hits. This makes sense considering a portion of the designed runs were QB sneaks up the middle which had a 100% hit rate and the field becomes much smaller in the red zone which increases the chance of QBs being hit. Given the sample size this could be misleading, but it was something that given the context is reasonable and something to look at in the future.
Key Takeaways
Although the average hit rate on rushing plays was over 60%, there were some QBs who are more prone to hits compared to others who slid or avoided contact by getting out of bounds. Here are some of those findings:
Safe Group
- Gardner Minshew: Mr. Mustache himself had the lowest hit rate and the third lowest big hit rate among the 12 QBs I sampled. Additionally, an overwhelming number of Minshew’s rushing attempts from 2019 were scrambles and not designed runs (94%).
- Kyler Murray: Of the Konami Code QBs, Kyler had the second lowest hit rate. Watching Kyler’s film, he was able to avoid contact by getting out of bounds on 34% of his rushing attempts. It makes sense a QB of his stature would want to avoid contact, and it was nice seeing him using his speed to get outside.
- Deshaun Watson: I was a little surprised by Watson’s numbers. Based on perception and his injury history, I would have thought he would have had one of the higher hit rates in the group. The results showed he had the 4th lowest rate. In fact Watson was actually hit more in the pocket than he was as a rusher, which makes sense given the Texans’ offensive line woes.
Riskier Group
- Dak Prescott: When we look at QBs with higher hit rates, Prescott led the entire group in hit rate and big hit rate. Over his 4 year career, Dak has been the epitome of health by never missing a game, but his hit rate stood out to me. It’s possible that Dak becomes more of a pocket passer and less of a runner in Mike McCarthy’s offense. Of his 40 carries, it was an even 50/50 split of scrambles to rushes.
- Lamar Jackson: Jackson’s hit rate and big hit rate did not really stand out, however the sheer volume of hits did. This makes sense given the number of rush attempts Lamar had in 2019. As a passer, Lamar never gets hit (only 3.8% of the time) but he appears to be taking more contact as a rusher.
- Josh Allen: Allen was near the top in both hit rate and big hit rate among QBs. Only Lamar Jackson had more red zone carries than Allen.
(Josh Allen sustaining a big hit during a rush attempt vs. New England)
Final Thoughts
As mentioned before, there are some limitations with all this data. The sample of Konami Code QBs was small and therefore it could be misleading. I’ll be the first to admit that. I wasn’t able to find any strong correlation between hit rate/big hit rate and injuries either, which is ultimately why this data would matter. I think there needs to be more research into this topic, but I had not seen anything like this before. Hopefully this can be a platform for more discussion/research to further elaborate on the topic.
I wouldn’t have been able to do this write-up without some people’s help. Therefore, I believe it’s important to highlight all of them here. For data collection and helping me with these numbers, I would like to thank Luke Neuendorf, Blake Hampton, Nicholas You, and Brian O’Connell. I would also like to thank Edwin Porras for discussing this topic with me and allowing me to use some of his content.
Last but not least, our graphics and editing team is the best. Andrew Mackens and Steve Houston deserve some love for all that they do! Don’t forget to follow The Undroppables as we continue to drop more content!