Home Blog Page 115

Konami Code Red

You may be wondering: “What the heck is a Konami Code, and why does it matter for fantasy football?” Back in the mid-80s, Nintendo developers needed a quick way to test the video game “Gradius” without losing progress due to the difficulty of the game. They created a cheat code that would give the player a full set of power-ups that would normally have to be earned throughout the campaign of the game. By entering the code sequence using the controller, the game developer received all available power-ups.

Originally, this code was meant to be removed prior to publishing the game, but this was overlooked and discovered later when the game was being prepared for mass production. The developers decided to leave it there, as removing it could result in new bugs and glitches. Eventually, word got out, and consumers became aware of how to use the Konami Code while playing to easily defeat the game. Simply put, the Konami Code was a cheat code. The Konami Code eventually found itself in other games including “Contra”.

Fast forward to 2013. Fantasy football analyst Rich Hribar publishes an article advocating for mobile/rushing QBs in fantasy football. The argument was simple. Rushing QBs score more fantasy points, and therefore are more valuable in all formats. Using them above other replacement levels QBs provided your fantasy team with such a competitive advantage, it was essentially cheating. Thus, the birth of the Konami Code Quarterback.

(Mr. Konami Code himself – Lamar Jackson, embarrassing Bengal defenders.)

The Konami Way

Hribar lays out the rationale perfectly for why mobile QBs are the way to go in fantasy football. By looking back at this past season, we see why his theory is validated. In 2019, eight of the top ten fantasy finishers at the quarterback position had at least 50 rushing attempts. The only two who didn’t reach that threshold: Aaron Rogers and Patrick Mahomes, who missed three games with a patella injury. Additionally, three of the top four QB finishers had at least 75 rushing attempts (Lamar Jackson, Deshaun Watson and Russell Wilson all are being drafted top 5 at their position in 2020). Looking at the QBs who started at least 10 games in 2019 and finished outside the top 20 on a points per game basis (QB21-QB30), we see that eight of them failed to rush the ball more than 35 times. The take home message here is simple. Generally, Quarterbacks who rush the ball often are more valuable than those who do not.

Finding Mobile Quarterbacks

Where the fantasy football community tends to frown upon the notion of “copy and paste rankings” for the following season, there is evidence that suggests previous rushing totals predict future rushing totals. Looking at Data from 2018 and 2019, there is a strong correlation between carries in year one (n) and carries the following season (n+1). 


Want a QB who runs the ball a lot? Just look at last year’s statistics. 

So Why Are We Here?

Well, with these Konami Code QBs running around more, there is a debate as to whether or not these players are at greater risk of injury. If we simply look at injury rates for QBs in the pocket vs. rushing outside the pocket, the data is rather underwhelming.

As Edwin Porras, DPT from Fantasy Points explains, there’s little evidence to suggest that these players are more at risk for injury. I would counter that it’s not that clear cut and there is some inherent risk that comes with drafting these QBs. When the quarterback  becomes a ball carrier, he’s exposed to a higher rate of hits. In my opinion, increasing the exposure to contact puts the player at a higher risk of injury.

I don’t think it’s far-fetched to argue that more body blows can increase the risk of a player breaking down. Allow me to further play devil’s advocate by laying out the following scenario. If a QB plays ten snaps, the first nine plays he runs the ball and is hit each time. Then on the 10th snap he throws from the pocket and is injured by a hit. How do we know that it was not an accumulation of those previous nine hits instead of just the last blow? Furthermore, what does the accumulation of those hits do to the player’s career?

My Research

The argument I’m making is that QBs contacted/hit at a higher rate are in fact at a higher risk of injury. Even if you disagree with the point, (and it’s okay if you do, because there’s still some holes in the data) the results of this little experiment will at least show which Konami Code QBs are “safer,” i.e. they slide or get out of bounds rather than exposing themselves to hits. 

For clarity purposes, I will supply my findings below and define what each term represents: 

  • Scramble: Broken play where QB went through some sort of read progression prior to deciding to tuck the ball and run.
  • Designed Run: Play that involved either a zone read where QB kept the ball or was designed for the QB to be the rusher. 
  • Hits: Number of times the play end with a defender tackling or pushing the QB to the ground.
  • Hit Rate: Percentage of hits per carry
  • Big Hits: From studying some film, it was evident that not all tackles were created equal. Therefore I labeled a cluster of these hits as “Big Hits” (I will admit this metric was more subjective). Big Hits involved plays where:1)The QB suffered a jarring blow from defender,
    2)The QB was hit in the head/face, or
    3) The QB was injured on the play
  • Big Hit Rate: Percentage of big hits per carry
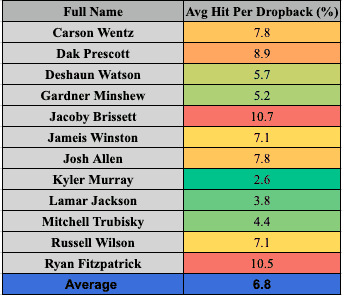
  • Hit Rate Per Drop Back: Rate that QBs were hit per drop back while passing the ball.

For my Konami Code QB population I used QBs who rushed the ball at least 40 times over the season, excluding kneel downs. This sample included 12 QBs: Carson Wentz, Dak Prescott, Deshaun Watson, Gardner Minshew, Jacoby Brissett, Jameis Winston, Josh Allen, Kyler Murray, Lamar Jackson, Mitchell Trubisky, Russell Wilson, and Ryan Fitzpatrick. I felt like this group was a good representation of the Konami Code QBs. I looked at every single rushing play for these QBs to determine if they were hit, slid to avoid contact, or got out of bounds. Obviously I would have liked to observe every rushing play for all the QBs in 2019, but for time’s sake and my own sanity, these were the QBs selected. However, if there is one limitation of my research here, it’s that the sample used is not an exhaustive list of the mobile QBs.

Results 

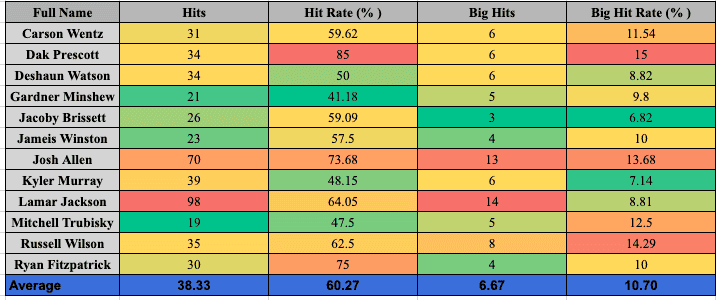
When looking at the previous two seasons, QBs were hit on average 6.8% of the time when passing the ball (sample of 125 QBs from 2018-2019). The Konami Code group was contacted nearly 10 times more at 60.3%. My findings also showed that the Big Hit Rate on rushing plays was 10.7%. The table below shows these findings. 
Konami Code
Hit rates on Konami Code QBs
Konami Code
Hit per Dropback %

I also wanted to compare the rate that Konami Code QBs were hit per drop back to the overall sample. The Results showed that average hit rate per dropback on passing downs was the same as the 125 QB sample from 2018-2019.

When looking at the correlation values from the data I collected, there was a decent relationship between both the number of designed runs and red zone rushing attempts with hits. This makes sense considering a portion of the designed runs were QB sneaks up the middle which had a 100% hit rate and the field becomes much smaller in the red zone which increases the chance of QBs being hit. Given the sample size this could be misleading, but it was something that given the context is reasonable and something to look at in the future.

Key Takeaways

Although the average hit rate on rushing plays was over 60%, there were some QBs who are more prone to hits compared to others who slid or avoided contact by getting out of bounds. Here are some of those findings:

Safe Group 

  • Gardner Minshew: Mr. Mustache himself had the lowest hit rate and the third lowest big hit rate among the 12 QBs I sampled. Additionally, an overwhelming number of Minshew’s rushing attempts from 2019 were scrambles and not designed runs (94%). 
  • Kyler Murray: Of the Konami Code QBs,  Kyler had the second lowest hit rate. Watching Kyler’s film, he was able to avoid contact by getting out of bounds on 34% of his rushing attempts. It makes sense a QB of his stature would want to avoid contact, and it was nice seeing him using his speed to get outside. 
  • Deshaun Watson: I was a little surprised by Watson’s numbers. Based on perception and his injury history, I would have thought he would have had one of the higher hit rates in the group. The results showed he had the 4th lowest rate. In fact Watson was actually hit more in the pocket than he was as a rusher, which makes sense given the Texans’ offensive line woes

Riskier Group 

  • Dak Prescott: When we look at QBs with higher hit rates, Prescott led the entire group in hit rate and big hit rate. Over his 4 year career, Dak has been the epitome of health by never missing a game, but his hit rate stood out to me. It’s possible that Dak becomes more of a pocket passer and less of a runner in Mike McCarthy’s offense. Of his 40 carries, it was an even 50/50 split of scrambles to rushes. 
  • Lamar Jackson: Jackson’s hit rate and big hit rate did not really stand out, however the sheer volume of hits did. This makes sense given the number of rush attempts Lamar had in 2019.  As a passer, Lamar never gets hit (only 3.8% of the time) but he appears to be taking more contact as a rusher. 
  • Josh Allen: Allen was near the top in both hit rate and big hit rate among QBs. Only Lamar Jackson had more red zone carries than Allen.

(Josh Allen sustaining a big hit during a rush attempt vs. New England)

Final Thoughts

As mentioned before, there are some limitations with all this data. The sample of Konami Code QBs was small and therefore it could be misleading. I’ll be the first to admit that. I wasn’t able to find any strong correlation between hit rate/big hit rate and injuries either, which is ultimately why this data would matter. I think there needs to be more research into this topic, but I had not seen anything like this before. Hopefully this can be a platform for more discussion/research to further elaborate on the topic.

I wouldn’t have been able to do this write-up without some people’s help. Therefore, I believe it’s important to highlight all of them here. For data collection and helping me with these numbers, I would like to thank Luke Neuendorf, Blake Hampton, Nicholas You, and Brian O’Connell. I would also like to thank Edwin Porras for discussing this topic with me and allowing me to use some of his content. 

Last but not least, our graphics and editing team is the best. Andrew Mackens and Steve Houston deserve some love for all that they do! Don’t forget to follow The Undroppables as we continue to drop more content!


The Undrafted | Mitch TruBortles Under-Bet

Scott talks shop with featured guest Etan Mozia of Dynasty Diagnostics. Topics include Broncos twitter beef, “Would You Rather Draft” questions, RB fades for 2020, and the importance of TE within redraft. With great insights from Etan & Jax we couldn’t cut this conversation short. Mitch TruBortles becomes a topic of debate and Jax touches base on the smash under bet you should be making. All that and more on Episode 2!

Unlock the Chalk | 2020 Redraft Targets

0

The Founder of The Undroppables @101Chalk, drops in to bring you some of his top targets against ADP in order to “unlock the chalk” for the 2020 NFL season.

Unlock the Chalk

Getting an edge over your opponents in fantasy football means you have to take calculated risks and stay ahead of the curve. Being late to the party means at best you’re in second place. In the eternal words of Ricky Bobby, “If you’re not first, you’re last.”

Wise Words.

To the unlock the chalk, I looked at the top 50 players on my rankings to see which ones I was at least 10 overall spots higher than the ECR and at least 5 spots higher in ADP (about half of a round).

Below are three players who I am significantly higher on than the Fantasy Pros Expert Consensus Rankings. By staying ahead of ECR, you’ll be able to snag these players at ADP (or slightly earlier) and watch them return significant value.

A.J. Brown

vs. ECR +16 | vs. ADP +6

A.J. Brown is still the alpha and Corey Davis is still a bust. Nothing has changed in terms of the pass catchers in Tennessee, and another year with Tannehill should mean improved efficiency and production for Brown despite the Titans’ run-heavy tendencies. There’s been chatter of a DeVante Parker-esque fifth-year breakout for Davis, but let’s not get ahead of ourselves. Maybe Davis does make a leap, but Brown will still command the majority of the targets in Tennessee.

David Johnson

vs. ECR +14 | vs. ADP +5

Coming off a couple of disappointing years, David Johnson seems primed for another workhorse role in a Deshaun Watson led offense (that lacks potent weapons aside from Will Fuller). Lest not we forget that Johnson was recently a top-tier RB1 with dual threat abilities. The Arizona offensive line did him no favors for Johnson last season, and a string of unfortunate injuries hurt his value further.

From offseason reports, Johnson has approached his preparation with a chip on his shoulder. And although we can only take those reports with a grain of salt, I wouldn’t wait until the end of the 5th round to see if I can snag him. I wouldn’t mind selecting him in the fourth round of a Superflex draft with third round consideration in a 1QB setting.

Stefon Diggs

vs. ECR +12 | vs. ADP +12

One of the best pure route runners and Reception Perception’s #1 WR continues to be disrespected every year. Diggs has had the misfortune of being tied to a run-heavy offense that limited his upside, to then being traded to a young team with a QB who has accuracy questions.

Selective bias is real, and we can point to all the negatives such as Allen’s accuracy concerns, but there are also several positives. Another knock on Diggs previously in his Minnesota days was that Adam Thielen was arguably the team’s #1 WR and thus commanded the priority reads from Cousins. Now in Buffalo, there’s no question who the alpha is, and that means Diggs will command a significant share of the targets with little competition behind him. Currently available in the mid- to late-seventh round in Superflex drafts, I’d take him a full round ahead ADP, in the sixth round over WRs like Tyler Lockett, DeVante Parker, Courtland Sutton, and D.K. Metcalf.

For more of Chalk’s and the rest of the team’s rankings, visit our redraft rankings page. You can also explore our other rankings for Dynasty Superflex and Offensive Lines via our main rankings page.


UNcomplicated Analytics | Fantasy Football has a Sample Size Problem

In the scientific community, small sample sizes are a constant problem investigators face. For example, in some neurological experiments, sample sizes of 22 and 24 were found to need to be at least 6 times larger to produce scientifically significant results, with several of these experiments having a recommended sample size in the 400-plus range to be representative of the population (Button et. al, 2013).

Welcome to UNcomplicated Analytics

No, you didn’t accidentally click on a scientific journal article; you’re still on the Undroppables. The scientific community just has a firmer grasp of statistics and biases that negatively affect data than the fantasy football community does. While the populations that the aforementioned studies refer to are a lot larger than what we use in fantasy football, the principles still apply to the football data we are looking at. Advanced statistics and analytics have massively increased in popularity in the NFL, especially in the fantasy football community. Knowing how to interpret these stats, which ones to trust, and which ones to be skeptical of can give the average fantasy football player an advantage that might just help you win your league. My hope is by the end of this article, (and throughout the rest of my series UNcomplicated Analytics) you begin understanding what the statistics you read are really telling you and uncover what they’re not.

Sample Sizes

To dive into why sample size is important, let’s first look at an example. During Week 13 of the 2017 season, the Tennessee Titans beat the Houston Texans 24-13. DeMarco Murray and Derrick Henry split carries for the Titans with 11 carries each. When you look at the box score, you wouldn’t be crazy to wonder why the Titans split carries so evenly. Derrick Henry averaged 9.9 yards per carry to Murray’s 6.0. Based on this data alone, Henry is obviously the more efficient back. He was averaging almost a first down for every rush attempt he had!

So why do I bring up a random game from 2017? With 46 seconds left in the game, Derrick Henry had a rush for 75 yards that went for a touchdown. Before that rush, Henry had 34 rush yards on 10 carries, an average of only 3.4 yards per carry. That single carry, the last offensive play by Tennessee in the game, increased his yards per carry by 6.5 yards. Many NFL analysts hate yards per carry for this exact reason, because it’s heavily influenced by outliers that exist within small sample sizes.

Key Takeaways

So now that we have a brief understanding of one of the issues of small sample sizes, how does knowing they’re an issue make us a better fantasy player? Here’s just a few ideas:

RULE ONE

Be very skeptical of small sample sizes, because they can cause us to draw the wrong conclusion. One of the worst offenders of this are splits that you see to highlight a specific player. While these can be great at isolating specific variables and situations, these usually do not tell the whole story. For a quick example, look at the table below:

Receiver with QB1Receiver with QB2
Games142
Targets per game62.5
Receptions per game3.52
Rec yards per game3910
TDs per game0.40


Wow, the receiver did really poorly with QB2 instead of QB1 so QB2 really was obviously his problem then. So off of one variable, we can conclude that this receiver is bad with QB2. But wait, there is a lot more to this story. If you haven’t figured it out, this is Mike Gesicki’s split with Ryan Fitzpatrick as QB1 and Josh Rosen as QB2. Was Rosen the reason Gesicki played poorly? Maybe. Was it the presence of Preston Williams? That’s also a possibility.

There are a number of variables that can describe why Mike Gesicki was very bad with his two games with Rosen at quarterback, and while Rosen might be the reason, we can’t conclude anything based on such a small sample size. If it actually was the presence of Preston Williams in the offense, (Williams was injured in Week 8 and missed the rest of the season; Rosen started Weeks 2 and 3) you might be higher on Gesicki because you liked his split with Fitzpatrick, only for quarterback play being the wrong variable influencing his play. There is not a quick fix to dealing with small sample sizes, but being aware and skeptical of this type of data will help you from falling for false narratives.

RULE TWO

Be wary of averages, such as yards per carry, yards per reception, and points per game, as these can be heavily influenced by outliers. Our Derrick Henry example from earlier perfectly displays this, but just to drive the idea home, let’s look at Will Fuller’s 2019 season. Changes to the Houston offense aside, if you pull up his profile in a draft this season, you might see an average of 12.2 fantasy points per game in PPR and immediately think he was a solid WR2/3 last season and draft him as such. If this was your way of thinking, you would have completely missed that he scored almost half of his points in a single game, and outside of that game he averaged 8.0 points per game.

A more effective way to look at player averages is to also look at their standard deviation. While it may sound like a lot, it will help you identify players that are prone to outliers. (If you want a simple way to plug in numbers and get a standard deviation, here’s a website that will do it for you). Player’s with higher standard deviations are more likely to have data points that are far away from their average. While you might want a player that is more likely to score significantly higher than their average, players with large outliers have positively skewed data and are more likely to score below their average.

Back to Will Fuller, the standard deviation for his points per game was 14.1. When we compare him to Odell Beckham Jr., who averaged just 0.4 points per game more than Will Fuller, we see that OBJ’s standard deviation is 6.0. At its simplest, this tells us that OBJ was more consistent with his points per game. (If you’re confused by standard deviation and what it means, here’s a simple run through and how it relates to distributions).

Final Thoughts

I wanted to start out this series with a simple concept and I hope the links help you have a firmer understanding of some of these basic statistics. I’ve barely scraped the surface of the issues of small sample size, and I look forward to diving deeper as I continue this series. Hopefully, this information helps you become a better fantasy football player and have a better grasp of statistics!

For questions, please reach out to Brian on Twitter: @Bpofsu

For more Undroppables analytics content, check out our RB Breakout Model, our 2020 Predictive Wide Receiver Model, and more on our analytics page.

References:

Button, K., Ioannidis, J., Mokrysz, C. et al. Power failure: why small sample size undermines the reliability of neuroscience. Nat Rev Neurosci 14, 365–376 (2013). https://doi.org/10.1038/nrn3475

The Undrafted | D.J. Chark Hand Holding

Scott introduces himself and the podcast. His first special guest, Tommy Mo of 2on1 Fantasy Sports, drops in to talk about a number of Fantasy Football draft topics, as well as Tommy’s big news – joining The Undroppables as a Senior Analyst.